FX Calendar

Monday, November 16, 2009

Approaching their highs (1 of 2)

What to do in a market which is relentlessly going up?
Plan to sell!

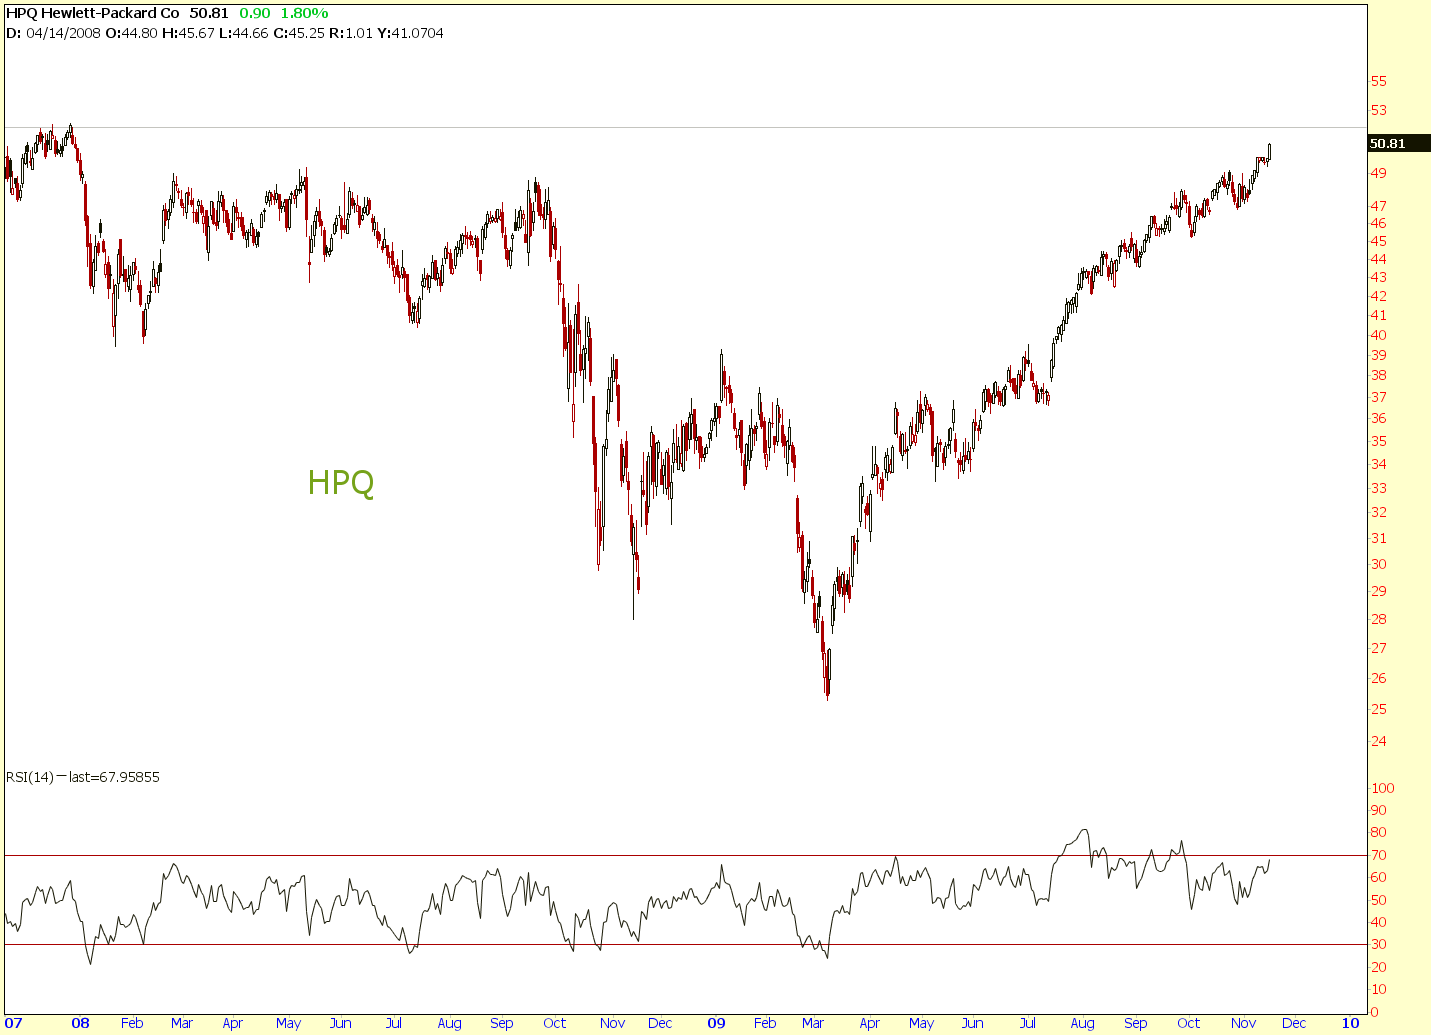
These charts are at or approaching their 52 week or 2 year or all-time high. What happens when the prices reach a previous high? Prices can move further high or may decline (or may consolidate). More often than not, markets have memory. The market tends to respect the previous high price level and the pullback is more probable at that level.


Saturday, November 14, 2009

XLF : Financial Sector Spdr


XLF is the Financial Sector etf that trades with heavy volume.


I have been bearish on this for the past few weeks but I picked up the wrong trade. Instead of selling a bear call spread, I bought puts. The loss in theta (time decay) has eroded all profit and some.


I am counting on to it weakening yet again. Note the weakness in momentum (RSI). Also the highs in Oct made a sort of evening star with abandoned babies!

Bearish charts

These charts appear bearish to me. They are either at resistance or approaching resistance. I am inclined to sell Bear Call Spreads for Dec on them provided the option premium is lucrative.

Near resistance.


Resistance is nearing.


Near resistance and trying to make a triple top with lowering volume.


At resistance.


At resistance and approaching all time high.


At resistance and has retraced 61.8% decline from the high.


Making a double top and is beneath the rising trend line.


Friday, November 13, 2009

Blockage of wisdom

During my recent travel, I was told by a savant that there are three enemies of wisdom.

He called them, "Blockage of Wisdom".

1. Little knowledge
2. Prejudiced thought
3. Invalid knowledge

The more I thought about it, the clearer it became that unknowingly (or not) he was referring to TA (Technical Analysis)!

Thursday, November 12, 2009

Head & Shoulders. Really?


Financial media was abuzz with Head & Shoulder pattern on the S&P 500 index in the beginning of July 09. That "failed" pattern dug a hole in wallets of many Technical wannabes. Lets be clear, if you hear about a Chart Pattern on TV, it is bound to fail. In other words, when everyone and their favorite cabby overwhelmingly believe that the Mr. Market is going to act in a certain way, Mr. Market is surely going to disappoint the majority and doggedly frustrate the mob.


Now our old friend VMW seems to be serious about its H&S pattern. Watch the price action since Sep 09 and you will see clearly S-H-S (shoulder-head-shoulder). The neckline is at $37.55. The target drop is $7.75 from the neckline, making $29.75 the target for pattern completion.


But the reason I like this pattern is because the volume action is confirming. Note the three blue slanting lines in the volume area. The volume is decreasing on all three rallies in the formation of S-H-S. This component makes the pattern more reliable and less prone to failure.


But failure may occur nevertheless. So, I am telling myself to go short (sell stop) at the breach of neckline, tighten the stop at $32.65 that happens to be support and target $30 for the pattern completion.




Wednesday, October 21, 2009

US 10 Year Treasury Note


Once again, I am looking for clues in Fixed Income to decipher the direction of Equity Markets. Generally, fixed income leads the equity markets.

Chart of US 10 year treasury note yield is in a short term down trend since 6-10-09. It is making lower highs and lower lows since then.

But the bearishness can be explained as a 4th wave pullback according to EWP (Elliott Wave Principal). But we need to be vigilant.

The primary and alternate counts are marked on the chart. The prices did surpass the two downward sloping trend lines in October but the crucial horizontal resistance at 3.5% is still intact. The RSI did turn back from 60 level this time. It seems as if the stage is set for the alternate count to become primary count in the next 2-3 weeks. But thereafter, if it is a 3 wave correction (looks to be a Zigzag so far), it will be followed by another 5 wave advance.

I keep on reminding myself that Fixed Income do lead Equities generally :)

Sell WFC


WFC chart looks bearish.

It has advanced about 400% from the March 09 lows. Though today it is about 375% from March closing low at $8. Lets look beyond their "earnings", "profit" and "losses" and see what the collective will of investors/trader tells about the price.

Volume: Volume increased in March sell off and was heavy during the initial advance. Accumulation did take place. Since July volume has been lower compared to previous 6 months.

Momentum: Momentum is waning. RSI failed to reach 70 on past two rallies. Its latest bounce from 40 level signifies that the bullish conditions prevailed. RSI breaking below 40 will confirm that the bear is back.

EWP: The advance from March is tracing out 5 waves as marked on the chart. As per Elliott Wave guideline of equality wave 5 is probably going to equal wave 1. That means wave 5 is over and now we will see a 3 wave a-b-c decline. One of the targets of the decline is previous 4th wave area at $22.50. There is support at $26 too, which may the bounce of b wave. The structure of abc correction needs to be observed as it unfolds.

Alternatively, wave 5 can also be 1.61 of wave and can take the price action to $37.50. At that point (or slightly below it) wave 5 will be equal to wave 3. If wave 5 exceeds $37.50 then the count is wrong.

In either case, presently the momentum and volume does indicate that wave is over. We will stick to that until proven otherwise.

Candlestick: The market has two hours of trading left and anything can happen yet. So far the price is chalking out a "gravestone doji". You know what it means; the death knell.

Going short or buying January puts seems to have good risk reward ratio.
Stop loss is at $31.54; exceeding the recent highs.
Initial target is $26, thereafter $22.50.